


Why this Metric
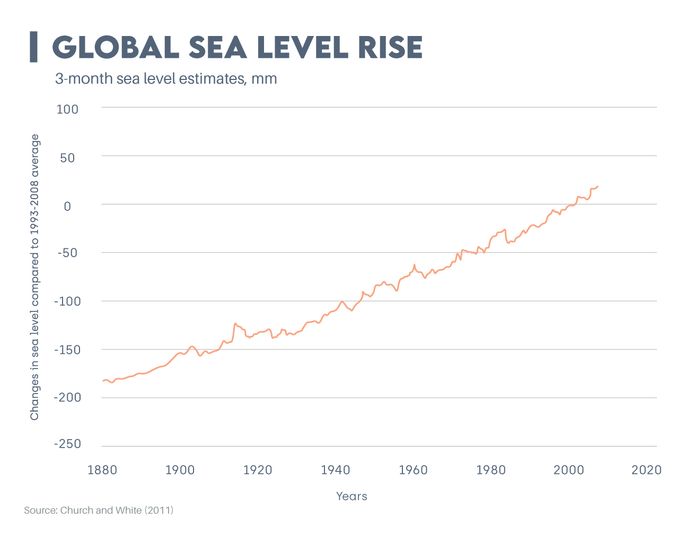
Global sea levels have risen by 21-24 centimetres (8-9 inches) since 1880. At that rate, we’d only be in for another 8 centimetres by 2100, but sea level rise has accelerated. Standing around 1.4 millimetres per year throughout the twentieth century, it more than doubled to reach 3.6 millimetres per year between 2006 and 2015.
Even if we followed a low emissions pathway from today on (which is unlikely), global sea levels would probably rise at least 30 centimetres above 2000 levels by 2100. Conversely, if we follow a high emissions pathway, the worst-case scenario would mean sea levels 2.5 metres above 2000 levels.
Exploring the Stat
Sea level rise’s acceleration is due to both faster ice melt from glaciers and ice sheets and thermal expansion of seawater as it warms. Higher background water levels mean that storm surges push farther inland than they normally would, increasing the damage caused by events like Hurricane Katrina. Many spots along the U.S. coastline are also experiencing 300% to 900% more high-tide floods than 50 years ago; less deadly than hurricanes but still disruptive and expensive.
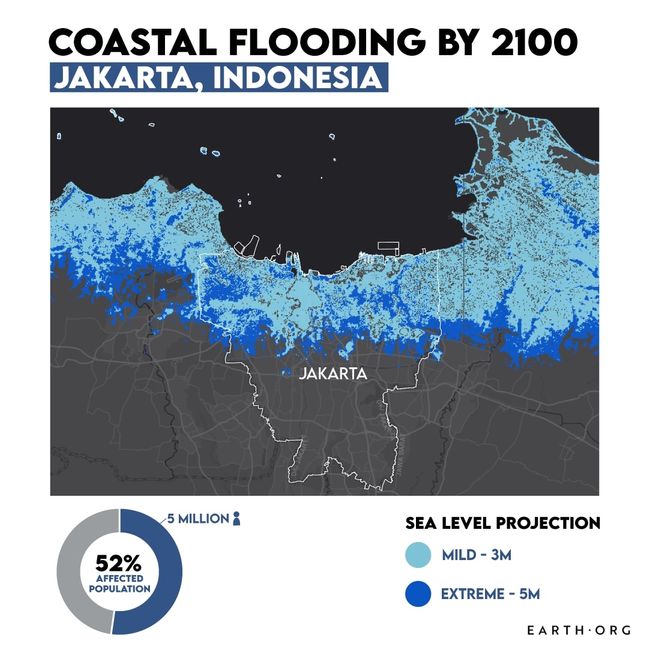
It is important to remember that the rise is not uniform around the world, and two different places at the same elevation may not be equally threatened. Jakarta, for example, is subsiding due to excessive groundwater extraction, making it extremely vulnerable to floods. Thermal, gravitational and wind dynamics can also make localized sea level rise faster than the global average.
In the near future, ports could also be compromised by the combination of rising sea levels and extreme weather. Key hubs in the Mediterranean, Arabic Peninsulas and South East Asia could be severely disrupted, left with a choice of adapting or displacing their infrastructure. The hit to shipping commerce, which represents 15% of global GDP, would be immense.
How We know
Sea levels have been monitored since the 18th century with tide gauges, and since the early 1990s with satellite altimetry. The relative contribution of thermal expansion was determined largely thanks to a fleet of aquatic robots, while that of ice melt is calculated with both on-site measurements and satellite-detected gravity shifts caused by water moving from land to ocean.
Future Outlook
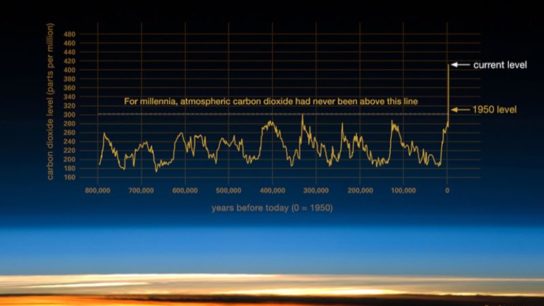
How much sea level rise we face will depend largely on the rate of future greenhouse gas emissions. The biggest risk factors are tipping points in the polar ice systems, or thresholds past which they become committed to a large amount of ice loss, no matter our actions from then on. Because we don’t know when the tipping point might be reached, taking a safer approach and assuming it is right around the corner is best.
Many of the most vulnerable areas in the world are slowly erecting defences against sea level rise such as dykes, sea walls, and better water evacuation. However, most remain terribly unprepared, especially for the fact that the defences they built are likely to be overcome within 20 to 50 years.
For some, like Jakarta, the only option is displacement. How its 10.5 million inhabitants will do so remains to be seen, and the world will be watching.
This article was written by Owen Mulhern.
Check out our other indices here.
![The Statistics of Biodiversity Loss [2020 WWF Report]](https://u4d2z7k9.rocketcdn.me/wp-content/uploads/2020/12/lprwinkyTHB-544x306.jpg)


