


As climate change amplifies, weather patterns become more unpredictable, leading to uncertainty in food production. This puts poorer countries like Kenya at higher risk of food insecurity – luckily, satellite data provides key solutions.
Earth.org takes a closer look.
—
Quick Summary:
- Satellite data has increased Kenyan Agricultural DECISION MAKING? efficiency by 70%
- Local crop insurance programmes were able to reach 13 times more people in 4 year time with the help of satellite data
Ranked in the Serious category in the 2020 Global Hunger Index (GHI), it is obvious that Kenya is struggling to feed its people. 75% of its population relies on farming for their food and income, and natural disasters like droughts, locusts and floods, worsened by climate change, can threaten lives.
(According to the 2020 GHI, around 821.6 million are considered undernourished or starved worldwide.)
Local crop insurance programs have been trying their best to mitigate these risks. In the past, Kenyan agriculture agents collected relevant information through field work, but this method consumes time proportionally to the amount of data it acquires, thus making large-scale analyses difficult.
Born of a collaboration between the Harvest team and the Regional Centre for Mapping of Resources for Development (RCMRD), the first National Crop Monitor, was launched in Kenya in mid-2018.
The team incorporates satellite data on rainfall, soil moisture, and land use to develop maps. These maps use computer analyses of satellite images and data to build high-resolution models of crop health and growth patterns. The map below is a simple cropland mask for Kenya in 2019, showing where these were growing at the time.
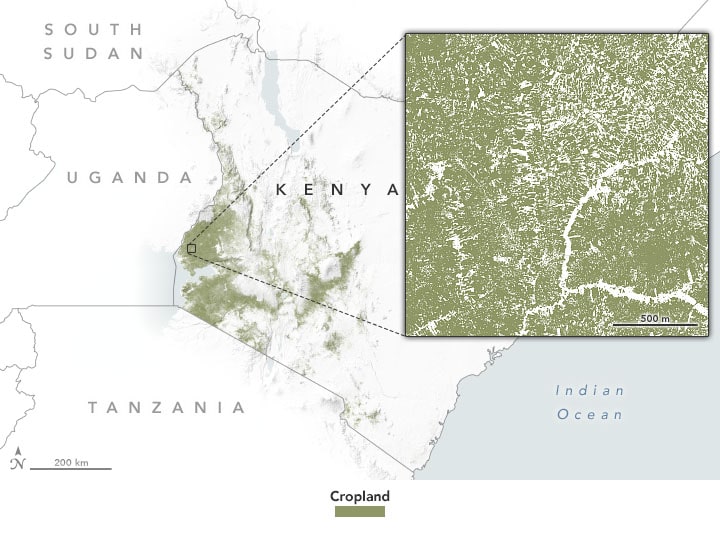
Source: NASA Earth Observatory.
The maps are incorporated into the Kenya crop insurance program, allowing the Ministry of Agriculture to better focus time and money. They report that the increase in efficiency has led to a 70% decrease in costs and staff time. Part of these savings helped the program support 425,000 farmers in 2019, compared to just 30,000 in 2015.
The next step for the project is to combine the crop maps with a general “greenness” indicator called the Normalized Difference Vegetation Index. It shows where all vegetation combined is thriving, versus where it isn’t.
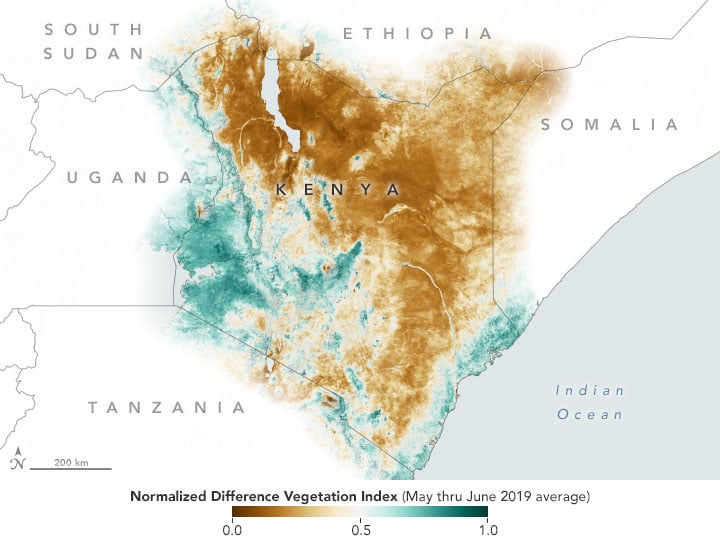
Source: NASA Earth Observatory.
By overlaying both datasets, Kenyan officials will be able to tell what farms need assistance or guidance from their offices.
As satellite data becomes more available, programs like these could make a huge difference in developing countries, saving costs while improving aid quality and timeliness.
This article was written by Wing Ki Leung.
You might also like: Waste Management: France and Turkey
Reference:
![The Statistics of Biodiversity Loss [2020 WWF Report]](https://u4d2z7k9.rocketcdn.me/wp-content/uploads/2020/12/lprwinkyTHB-544x306.jpg)


