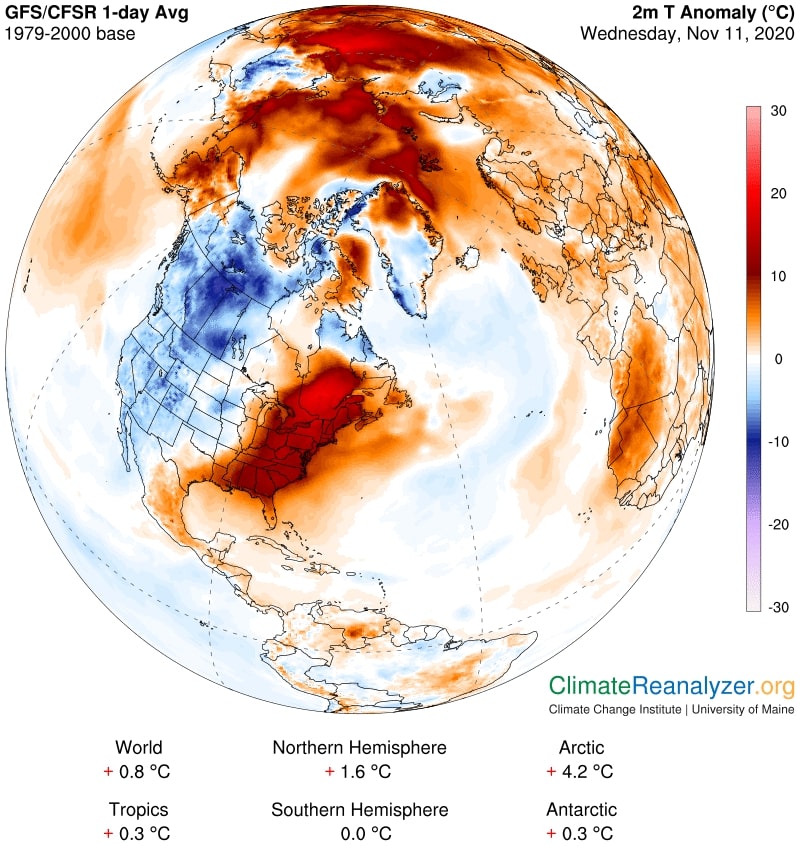
Daily weather maps created by the Climate Reanalyzer platform show yesterday’s temperatures relative to a 1979-2000 baseline around the globe. No, today isn’t wildly different from yesterday, nor will it be from tomorrow; this is just the current state of our climate.
—

The situation: Aside from a big chunk of North America, the Northern Hemisphere is experiencing far higher temperatures than usual at this time of year.
- We are 1.6°C above average across the board, with a peak nearly 20°C above the norm in eastern North America.
- More alarming still is the Arctic itself, with temperature 4.2°C hotter than they should be, if not hotter than expected. Once again, some places are a ridiculous 20-25°C warmer than usual.
You don’t have to be a climate scientist to suspect this will fundamentally change the environmental balance our north pole has enjoyed over the last 12,000 years.
The takeaway: Relatively small changes in global averages result in huge swings in extremes. The Arctic could be called the focal point of climate change right now, both because it is being hit hardest, and because the consequences will literally trickle down to affect the rest of the planet.
The Methodology:
- This map depicts output from the NOAA Global Forecast System (GFS) model, which produces 4 daily 16-day forecasts.
- 2m Temperature Anomaly refers to the “departure of the current day’s forecasted temperature from a long-term mean for the same day of the year”.
This article was written by Owen Mulhern.
You might also like: Why No-Take Zones Matter: the Mozambique Example
References
-
Image from Climate Reanalyzer (https://ClimateReanalyzer.org), Climate Change Institute, University of Maine, USA.


![The Statistics of Biodiversity Loss [2020 WWF Report]](https://u4d2z7k9.rocketcdn.me/wp-content/uploads/2020/12/lprwinkyTHB-544x306.jpg)


