


Air pollution is the third leading cause of death worldwide, and most large cities, London included, have fine particulate matter (PM2.5) levels above WHO health guidelines. Here, we take a look air pollution mapping in London to better understand the current situation, and where things may be heading.
—
The first energy crisis occurred in 16th Century England, when wood was still the standard material utilized in buildings, transportation, tools and heating. Forests cover had already been reduced to about 7% of total land area, and rapid urban expansion, especially around London, was causing shortages. Indeed, the capital’s population “multiplied at least eightfold, from some 60,000 in 1534 to some 530,000 in 1696”, writes John U. Nef, a 20th century economic historian.
Coal had been burned in London since the beginning of the 13th century, pushing Eleanor d’Aquitaine to log the earliest known complaint against its fumes in 1257. The ore had been used by humans for a couple thousand years at this point, notably in China 3 thousand years prior to our day. Different societies used it at their own rates, but it did not become a global staple until England fully adopted it to solve its deforestation crisis between 1550 and 1700, eventually leading to the Industrial Revolution.
One of the earliest known works on air pollution was a pamphlet published in London in 1661 called the Fumifugium, or The inconveniencie of the aer and smoak of London dissipated together with some remedies humbly proposed by J.E. esq. To His Sacred Majestie, and to the Parliament now assembled. If you can still breathe after reading that out loud, you probably come from an area with low air pollution. Jokes aside, it rightly accused coal of poisoning the air, proposed that wood would be a healthier option, and recommended that polluting industries be moved outside the capital.
Scholars of the newly formed Royal Society were quick to praise the pamphlet, but it gained no traction among policymakers. Nonetheless, it reflected a growing awareness on the issue of air pollution in a society unschooled in environmental issues as we are today. Lines were being drawn between air pollution and London’s higher mortality rates, lower plant diversity, and visibly accumulating particulate matter. London’s fog was notorious, known to halt railway journeys, economic activity and encourage rampant crime. The city as a whole experienced 80 dense fog days per year, but depending on the area, with the record high standing at 180 in 1885.
Indeed, complaints about fog are as old as the city’s coal usage, but a lack of rural data made it difficult to prove fog days were multiplying. Many years later, we have a reconstruction of London’s air pollution levels through time based on an economic analysis (Fouquet, 2011).

From a peak that stands above that of Delhi 4 years ago, the beginning of London’s air pollution decline coincides with the UK’s 1891 Public Health Act, under which excessive smoke emissions could encounter financial penalties if efforts weren’t made to adopt cleaner practices. This began the century-long decarbonization movement in London, with industries shifting to less polluting forms of coal, while heating and cooking largely switched from coal to gas.
More recently, air pollution was marked by the implementation of the congestion charge in 2003, which came about after London’s officials visited Singapore and witnessed its Electronic Road Pricing system. Charging vehicles within a large perimeter around the center, traffic was notably reduced, dropping fine particulate matter (PM2.5) with it.
Now, with the most recent PM2.5 data (from 2016), and using Berkeley Earth’s PM2.5 to cigarette equivalent, we mapped the cigarettes smoked per week across London.
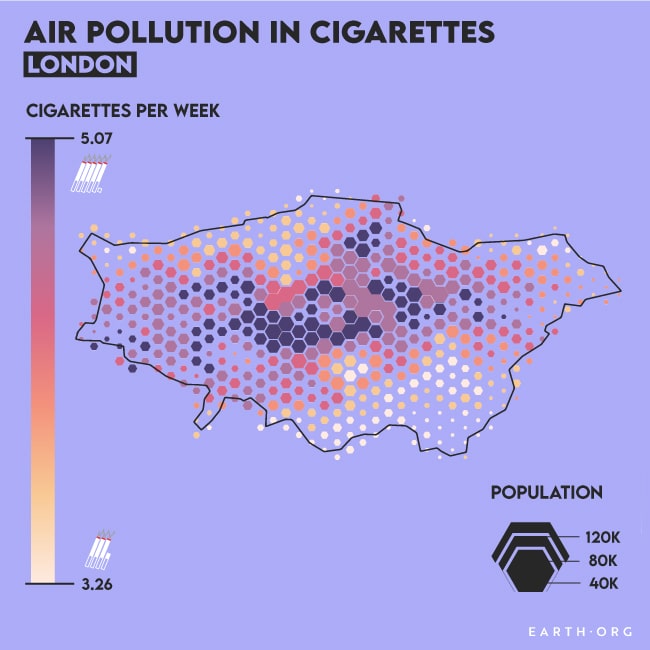
Air pollution mapping in London. PM2.5 data from NASA-SEDAC (2016).
As we can see, the entirety of London’s population was breathing in an equivalent of 3 to 5 cigarettes per week (~15 ????g / m3) from pollution in 2016. This puts the entire city above the WHO guideline PM2.5 concentration, which did not go unnoticed by the authorities.

Sadiq Khan entered mayoral office in 2016, when his constituents were suffering ~9,000 premature deaths per year due to air pollution. A year later, London was the first world megacity to sign up the WHO’s “Breathe Life” campaign, whose signees commit to meet the WHO guidelines for PM2.5 by 2030.
Interestingly, much of the city’s PM2.5 comes from regional and even transnational sources; even in 2016, its own background level was already as low as 10.2 ????g / m3. Still, tackling road emissions by electrifying the vehicle fleet, and improving pedestrian, cycling and public transport options would greatly reduce PM2.5.
As of early 2021, inner London emissions are on the decline, partly thanks to the inauguration of the ultralow emission zone, which charges a daily fee to vehicles based on their emissions profile.
An important takeaway here is that all large cities went through periods of extreme pollution as they developed, which means that high pollution areas today are so because it is practically unavoidable. This also means that there will be much more to come, especially in Africa, and it could benefit us all to speed up renewables’ rise as the most cost-efficient option.
This article was written by Owen Mulhern.
You might also like: Air Pollution in Paris
![The Statistics of Biodiversity Loss [2020 WWF Report]](https://u4d2z7k9.rocketcdn.me/wp-content/uploads/2020/12/lprwinkyTHB-544x306.jpg)


