


Air is a core element for the sustenance of life. The cleaner the air, the better your health and well-being. However, various sources, especially anthropogenic, are posing a significant threat to air quality. In this article, we take a closer look at the situation in India, a country whose rapid expansion has seriously diminished air quality.
—
Pollution is the greatest risk to human life, more so in India than in any other country. Air Quality Index (AQI) is a numerical scale used to measure and report air quality of an area on a given day. Eight pollutants namely PM10, PM2.5, NO2, SO2, CO, O3, NH3, and Pb are the major parameters taken into consideration while deriving AQI of a region. Public health risks increase as the AQI rises. The following table shows the Air Quality Index (AQI) Categories and the Health impacts associated with each category.

Central Pollution Control Board, a statutory organization under the Ministry of Environment and Forests, Government of India, provides air quality data and AQI at an hourly and daily basis of various stations across cities in India. By analyzing the daily AQI data for different cities of India, it was found that Ahmedabad, Delhi, Patna, Gurugram, and Lucknow have the highest AQI values on an average daily basis for the year 2015- 2019.
| Cities | Average of Daily AQI
[2015-2019] |
| Ahmedabad | 484 |
| Delhi | 267 |
| Patna | 252 |
| Gurugram | 234 |
| Lucknow | 224 |
From the above table, it can be observed that Ahmedabad is in the “severe” category. The health impacts associated with such high levels of AQI are many. Even people with no prior respiratory problems are also vulnerable to respiratory disorders. People from the other four states including the National Capital of India, Delhi, have a higher incidence of respiratory disease than normal.
A city of our particular interest in India is New Delhi, the capital city of India. WHO and the United States Environmental Protection Agency ranked New Delhi as the world’s most polluted city in 2014 and 2016 respectively. The State Government of Delhi, in the recent past years, has taken some stringent measures – Odd-Even Regulation, a complete ban on coal-based power plants, suspending construction sites during peak pollution season, etc – to keep a check on air pollution. Regardless of the measures taken by the State Government of Delhi to curb air pollution, the AQI continues to be on the dangerous mark. The below chart shows levels of different pollutants in Delhi on a random day early this year.
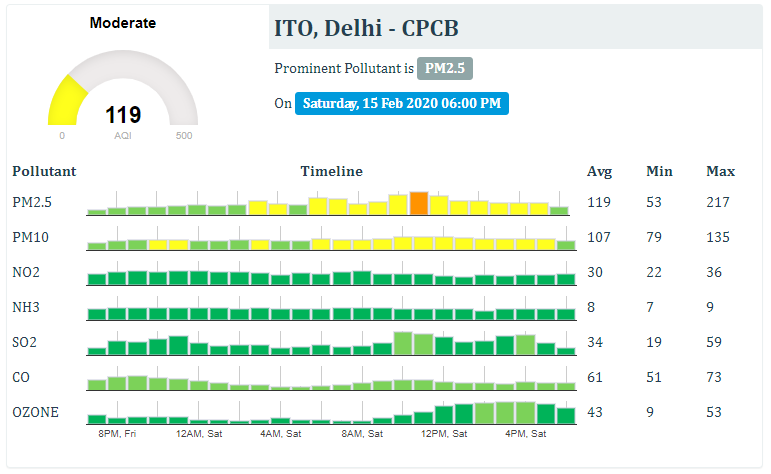
From the above chart, we can see that the PM2.5 value on the said date is nearly double that of the permissible levels as per the Central Government of India. The following table shows the permissible levels of some pollutants according to the standards set by the Central Government of India (in red, those for PM2.5).
| Pollutant (ug/m3) | Time Weighted Average | Concentration in Ambient Air | |
| Industrial, Residential, Rural and Other Areas | Ecologically Sensitive Area (notified by Central Govt) | ||
| PM2.5 | Annual | 40 | 40 |
| 24 hours | 60 | 60 | |
| PM10 | Annual | 60 | 60 |
| 24 hours | 100 | 100 | |
| NO2 | Annual | 40 | 30 |
| 24 hours | 80 | 80 | |
Taking the WHO air quality guidelines into consideration, such elevated values of PM2.5 can increase long-term mortality risk by 15%.
For the past few decades, the world has been bustling with various human activities that tremendously contributed to air pollution. But 2020 brought everything to a halt. The coronavirus pandemic started spreading like wildfire and many countries resorted to lockdown. A boon of the coronavirus situation, if any, is the positive impact it had on the environment because of the lockdown imposed to prevent the spread of the disease. On March 25, 2020, the Government of India placed its population of more than 1.3 billion citizens under lockdown in an effort to curb the spread of the COVID-19. To explore whether the lockdown alleviated the pollution, we have compared the AQI data of March-April of the year 2019 and 2020. The daily average AQI value for March- April 2019 is 656 and this value drastically reduced to more than half to 306 in March-April 2020. Click on the highlighted points on both sides of the graph to compare the AQI values for various cities in India during March-April for the year 2019 and 2020.
The figure below on the right shows the tropospheric NO2 concentration over India on April 5, 2020, while the left figure shows the concentration on the same day of the previous year. Every year, In the month of April, the NO2 concentration is typically on the higher side for states such as Delhi-NCR, some regions of Jharkhand, Chhattisgarh, Odisha, Ahmedabad, and Goa. However, in 2020, we can see that there is a significant decrease in the emitted NO2 over the Northern and western regions as well as in Delhi and Ahmedabad. 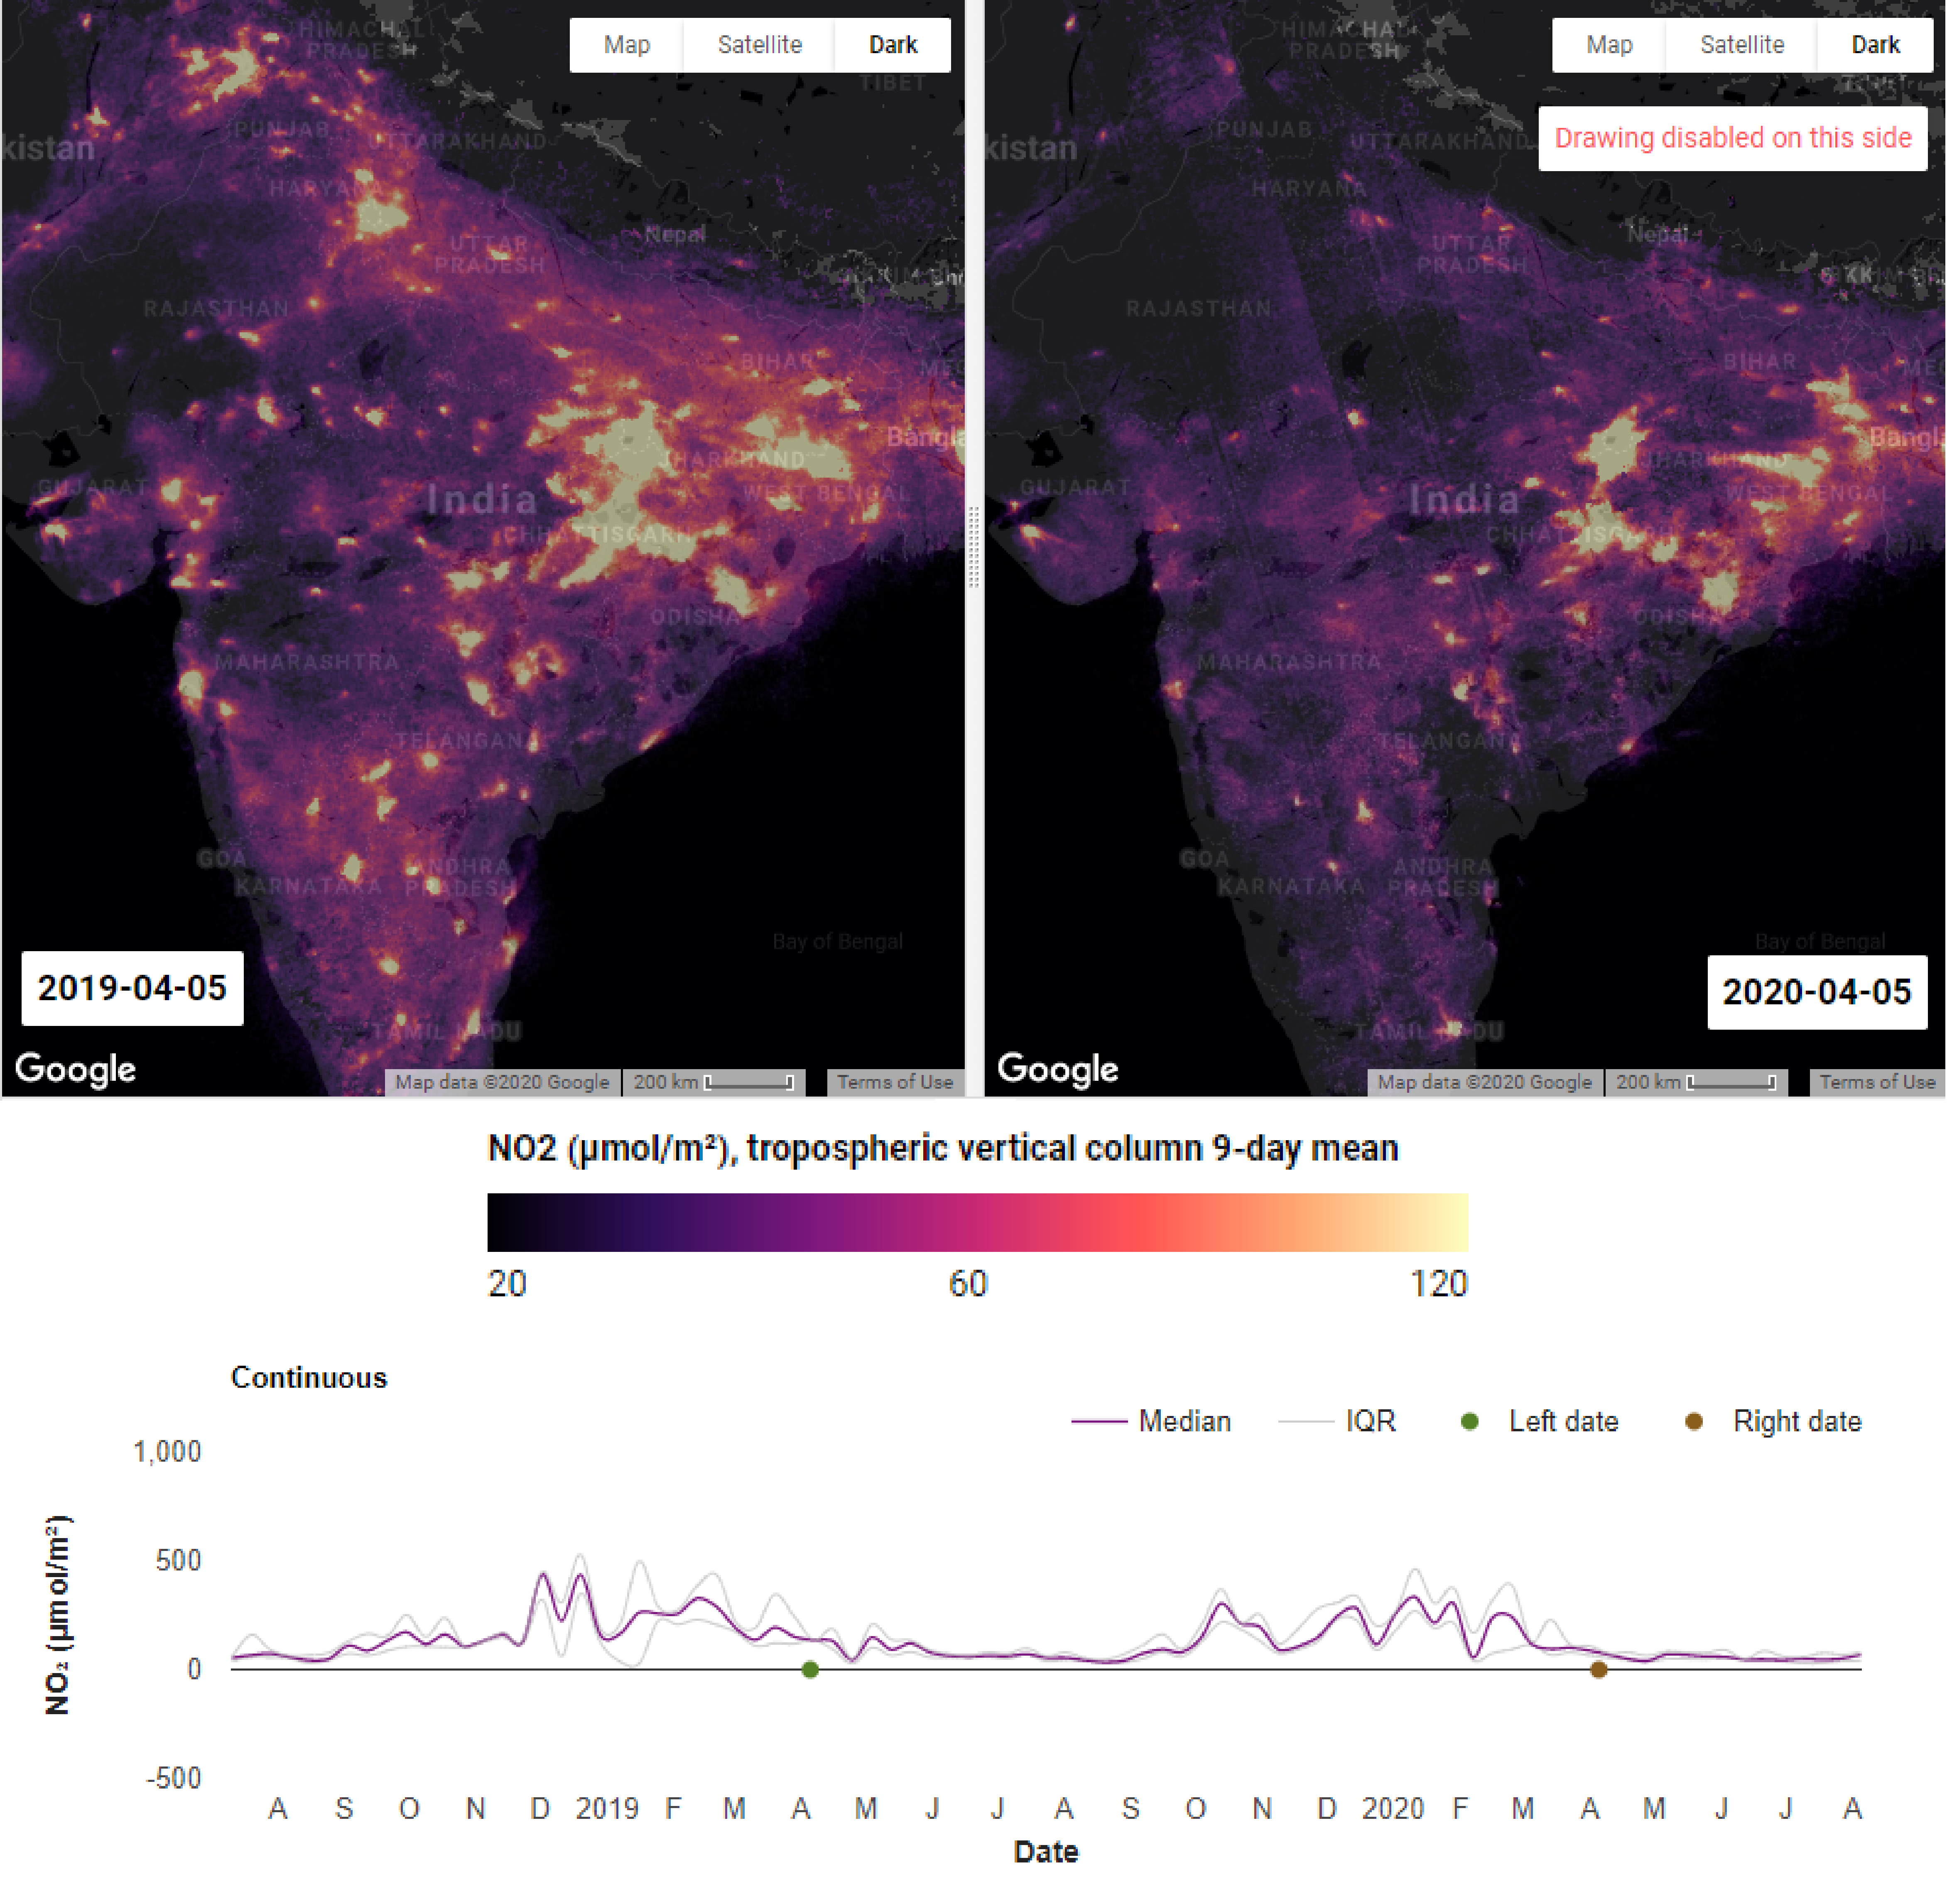
Further, if we analyze the graph given below, it can be seen that there is a remarkable decrease in the value of NO2 post lockdown.
The alarming statistics have raised concerns about the poor air quality in the country and the associated health risks. The prevailing air quality issue must be addressed immediately. Air pollution policies and regulation must be revamped, sustainable development must be promoted, and the general public must be enlightened about the health risks associated with poor air quality and how they can mitigate the problem by embracing small yet significant changes in their day to day life.
This article was written by Neeti Nair.
You might also like: The Evidence For Global Warming
![The Statistics of Biodiversity Loss [2020 WWF Report]](https://u4d2z7k9.rocketcdn.me/wp-content/uploads/2020/12/lprwinkyTHB-544x306.jpg)


