


Guest post by Krishna Rao.
Researchers have historically struggled to map forest dryness- a key indicator of wildfire risk- due to its high variability in space and time. AI is now assisting them in mapping forest dryness at high resolution for the first time ever in the western United States.
—
Forest wildfire risk is increasing in the western United States. In the past five decades, large wildfire frequency and the area destroyed have risen by more than four and six times, respectively. The increased risk posed by wildfires has prompted scientists to try to assess wildfire risk to help inform whether to move people to safety before disastrous wildfires occur.
To overcome this challenge, we used vast amounts of data with deep learning to produce dynamic forest dryness maps of the western US for the first time ever. These maps may eventually lead to improved wildfire risk assessments.
Wildfire risk and the role of forest dryness
In wildfire risk assessments, forest dryness — an important predictor of wildfire ignition and spread — is estimated using meteorological indicators such as prior precipitation and temperature. Researchers refer to forest dryness as live fuel moisture content (LFMC) because it indicates the amount of water in fuels, like trees and shrubs, relative to their dry biomass. Lower the live fuel moisture content, drier the fuels, greater the risk of wildfires, and vice-versa.
However, meteorological indicators do not always represent true forest dryness. Just like the plants on your balcony, different plants have unique strategies to respond to drought. Some might be able to conserve water by closing their stomata (pores on leaves) while others might not. Some might be able to gain more water by growing deeper roots, while others might not. However, mapping what species grow where and how each of them responds to water stress is difficult. Thus, fire models often ignore these effects. This may lead to incorrect estimations of forest dryness, ultimately introducing errors in our wildfire risk assessments. How can we do better?

Forest dryness measurements conducted by the United States Forest Service between 2016–2019. Image by author.
When we saw the US Forest Service collecting thousands of forest dryness measurements across the western US, we saw an opportunity. Using those measurements as ground-truths, we trained a neural network with satellite data to estimate forest dryness for the whole of the western US as explained below.
Forest dryness sensed from space
Although observing forest browning and greening is common, observing forest dryness (and wetness) is challenging because we cannot see the water inside the trees. While some models exist to estimate forest dryness, they fail to scale because they need to know the geometry of vegetation canopies. As a result, scientists have been able to estimate forest dryness of only 5–17 species of vegetation. By letting a neural network figure out the effects of canopy geometry using various remotely-sensed inputs, we were able to map forest dryness over the entire western US by validating 56 different species.
On validation, we found that our landscape-scale forest dryness maps were as accurate as other smaller-scale analyses. The vast amounts of ground-data available for model training, combined with the modifications performed to the neural network based on domain-knowledge yielded this result. Check out more technical details of the model.
With dynamic, wall-to-wall maps of forest dryness now available, we plan to test the sensitivity of wildfire occurrence and size to forest dryness. In the process, we will quantify the value of these forest dryness maps for wildfire risk forecasting.
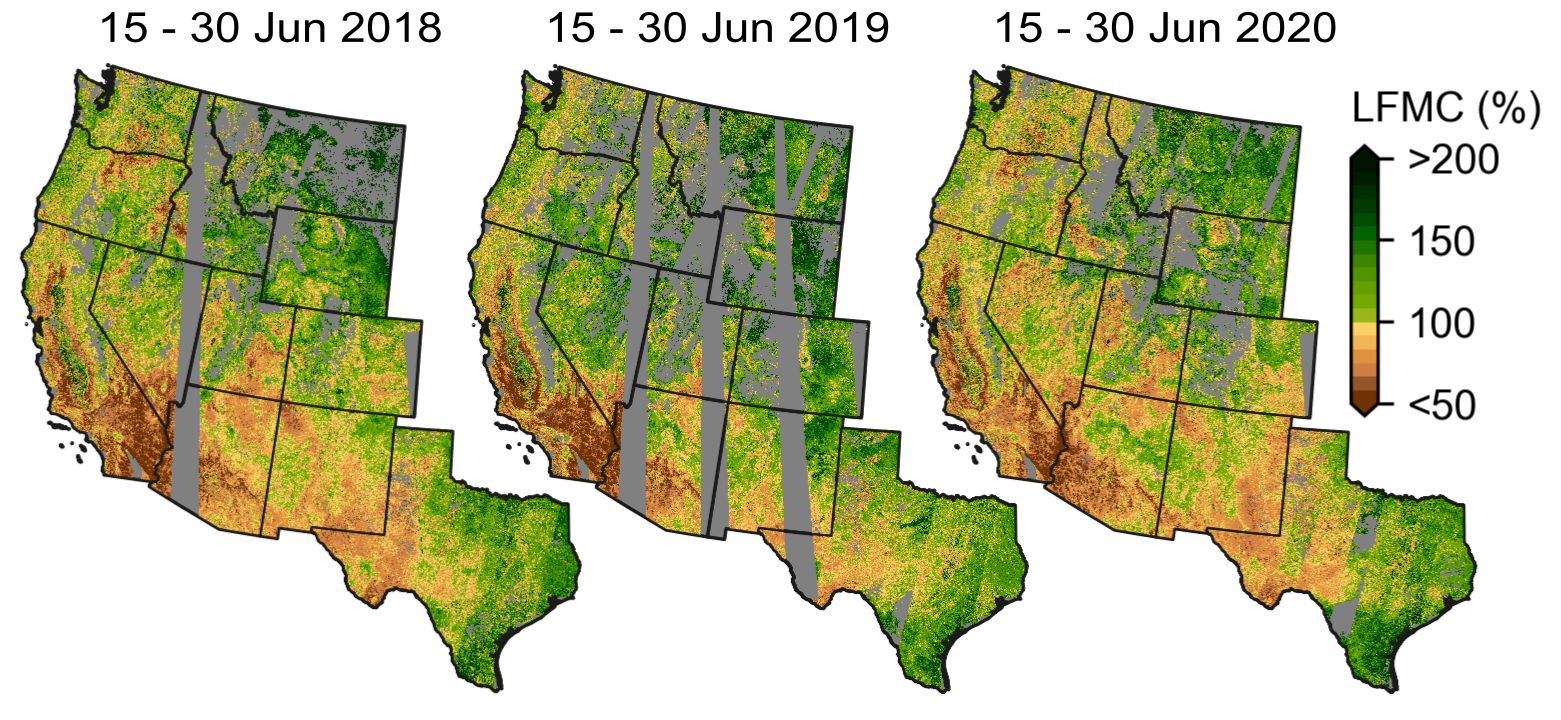
Forest dryness mapped using our deep learning model. Forest dryness is displayed as a percentage of water in trees relative to their dry biomass. Image by author.
Explore the dynamics of forest dryness in your local neighborhood in the western US using our web app.
This article was written by Krishna Rao.
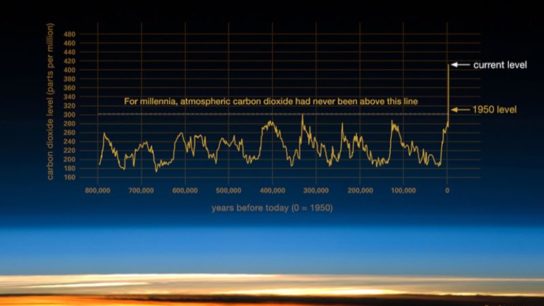
You might also like: A Brief History of CO2
![The Statistics of Biodiversity Loss [2020 WWF Report]](https://u4d2z7k9.rocketcdn.me/wp-content/uploads/2020/12/lprwinkyTHB-544x306.jpg)


